Vetting a site before you pay
How to read a site's traffic history before you buy a link

A seller's traffic number is like a used-car dealer's mileage: one number, and it's the seller's choice. The true answer is the story behind it, and you'll find 24 months of that in most traffic tools.
This guide gives you four readings to take from that line, the threshold for each, and the figures from our own checks so you know what normal looks like.
Before you start: get the right chart
You want monthly estimated organic visits from Google and the count of ranking keywords, both for at least 24 months. Any tool that estimates traffic history will do. These are modelled estimates built from search rankings, so use them for the shape of the line and treat the exact figures loosely.
Work in 3-month averages throughout. "Now" means the average of the latest 3 months. "Peak" means the best run of 3 months in a row anywhere in the window.
Reading 1: retention against the peak
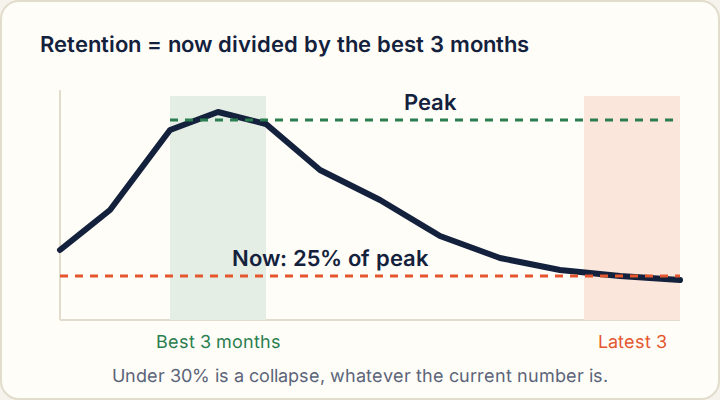
Retention = latest 3-month average ÷ best 3-month average.
| Retention | What it means | What to do |
|---|---|---|
| 90% or more | At or near its best. Growing or holding. | Good sign. Go on to the other readings. |
| 60% to 90% | Off its peak, still most of the way there. | Fine if the direction reading is flat. |
| 30% to 60% | Has lost a large share of its readers. | Buy only if it has steadied and the price reflects it. |
| Under 30% | Collapsed. | Walk away. This is our fail line. |
The 30% line is the threshold we use. The bands above it are our rule of thumb for reading the rest.
What traffic histories look like in practice
These are sites that had already passed checks for being live, on topic and free of gray-topic posts. On the surface they look like normal working blogs. Most are far from their best, and you can't see it from a current number or from a domain score.
Reading 2: current direction
Retention is the distance a site has fallen. Direction tells you whether it's still descending.
Direction = latest 3 months against the 3 months before them.
| Change | Reading |
|---|---|
| Up, or within 20% either way | Steady. |
| Down more than 20% | Falling now. Check the season before you decide. |
| Down more than 20% for two quarters running | A slide, not a wobble. Wait or walk. |
A site at 45% of its peak that has been flat for a year has found its floor. A site at 70% that lost a quarter of its traffic in the last three months has not. The second is the riskier purchase, even though its retention is better.
Reading 3: the season
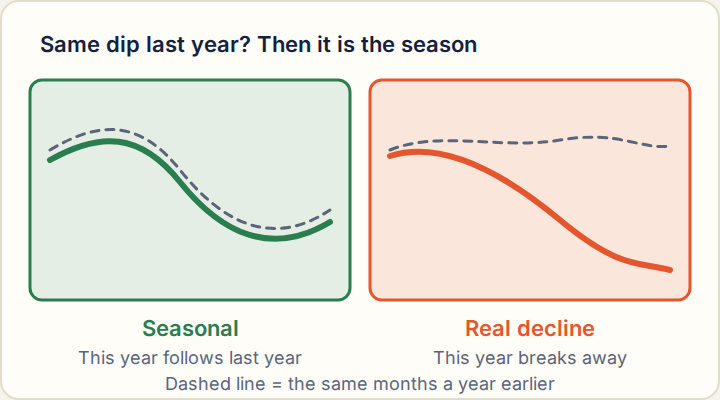
Home, garden and DIY sites lose traffic every winter and gain it back in spring. A 25% drop from summer to winter on a gardening blog is the calendar.
The test: take the latest 3 months and the same 3 months a year earlier. If this year is at 80% or more of last year, call the drop seasonal. Below that, it is a real decline that happens to coincide with the season.
That's why 24 months is important. With 12 months of data, you can't run this test at all.
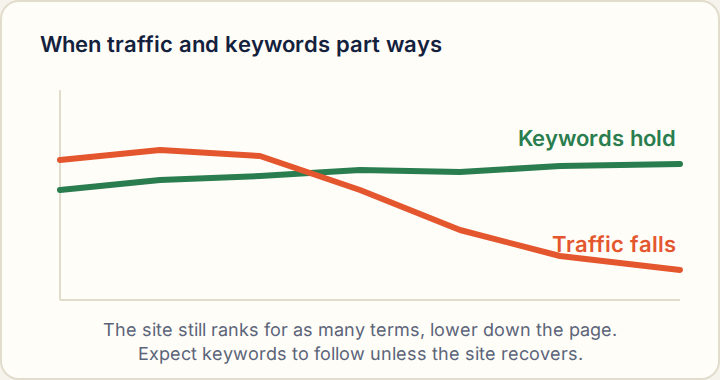
Reading 4: keywords against traffic
| Traffic | Keywords | Likely story |
|---|---|---|
| Down | Down | The site is losing rankings across the board. The clearest bad sign. |
| Down | Flat or up | Still ranking for as many terms, but lower on the page, or for terms nobody searches. |
| Up | Down | Leaning on fewer pages. One ranking change could undo the gain. |
| Up | Up | Healthy growth. |
In our data, of 335 sites with a year of comparison, 135 had both traffic and keywords down more than 20%. Another 28 had traffic up while keywords fell more than 20%. Sites with traffic down and keywords holding were too few to report.
We also fail any site whose keyword count averages under 100, whatever its traffic. A site with visits and almost no ranking terms is getting those visits from one or two pages.
The spike check
Look at the first few months of the chart. If the site had almost no traffic a year ago and has a healthy amount now, ask why. Real blogs don't usually go from nothing to thousands of visits in months.
The common cause is an expired domain that someone bought for its old links, filled with new articles and put up for sale as a guest post site. We mark a site Watch when it had under 50 visits a month a year ago and more than 1,000 now. Our guide to recycled domains covers the other signs.
Three sites, one current number
These three are invented. Each has 4,000 visits a month today.
| Site A | Site B | Site C | |
|---|---|---|---|
| Peak (best 3 months) | 4,300 | 16,000 | 4,100 |
| Retention | 93% | 25% | 98% |
| Latest 3 vs. 3 before | +4% | -18% | +60% |
| Same months last year | 3,600 | 11,000 | 30 |
| Keywords, year on year | Up | Down | Up sharply |
| Reading | Steady. Buy. | Collapsed. Walk. | Spike. Check the domain's past. |
A seller would call all three "4,000 visits a month". The only difference is the history.
How to check this yourself
- Open the site in a traffic tool and set the range to 24 months of organic traffic, with ranking keywords on the same chart if the tool allows.
- Write down three averages: the latest 3 months, the 3 before them, and the best 3 in a row.
- Work out retention. Latest divided by best. Under 30%, stop here.
- Work out direction. Latest against the 3 before. Down more than 20%, go to the next step before deciding.
- Run the season test. Latest 3 months against the same 3 a year earlier. At 80% or more, the drop is seasonal.
- Compare the keyword line. Note whether it moves with traffic or against it, and check the count is over 100.
- Look at the first months of the chart. Near zero then, busy now, means you check the domain's history before anything else.
Questions buyers ask
- How accurate are third-party traffic estimates?
- They are models built from search rankings, and they can be well off a site's real analytics. They are reliable for the shape of a trend, which is what these four readings use.
- Can I ask the seller for their analytics instead?
- You can, and a screenshot is better than nothing. It is also easy to crop or fake, and it will not show you 24 months unless you ask for it. Use it alongside an outside estimate.
- Is falling traffic always a reason to walk away?
- No. A seasonal dip is normal, and a site that fell and then held steady for a year can still be a fair buy at the right price. A collapse below 30% of peak, or a slide that is still going, is the reason to walk.
Related guides
Sources
Last updated Methodology